

Forecaster Charts & Tables
Employment
Good jobs creation and low unemployment rates are pivotal to GDP growth and Â鶹´«Ã½Ó³» activity.
Change in Total Employment — Â鶹´«Ã½Ó³» vs U.S.

The latest data points are for March 2021.
*“Year-over-year� is each month versus the same month of the previous year.
Data sources (seasonally adjusted): Statistics Â鶹´«Ã½Ó³» and U.S. Bureau of Labor Statistics (Department of Labor).
Chart: ConstructConnect — Â鶹´«Ã½Ó³».
Change in Construction Employment — Â鶹´«Ã½Ó³» vs U.S.
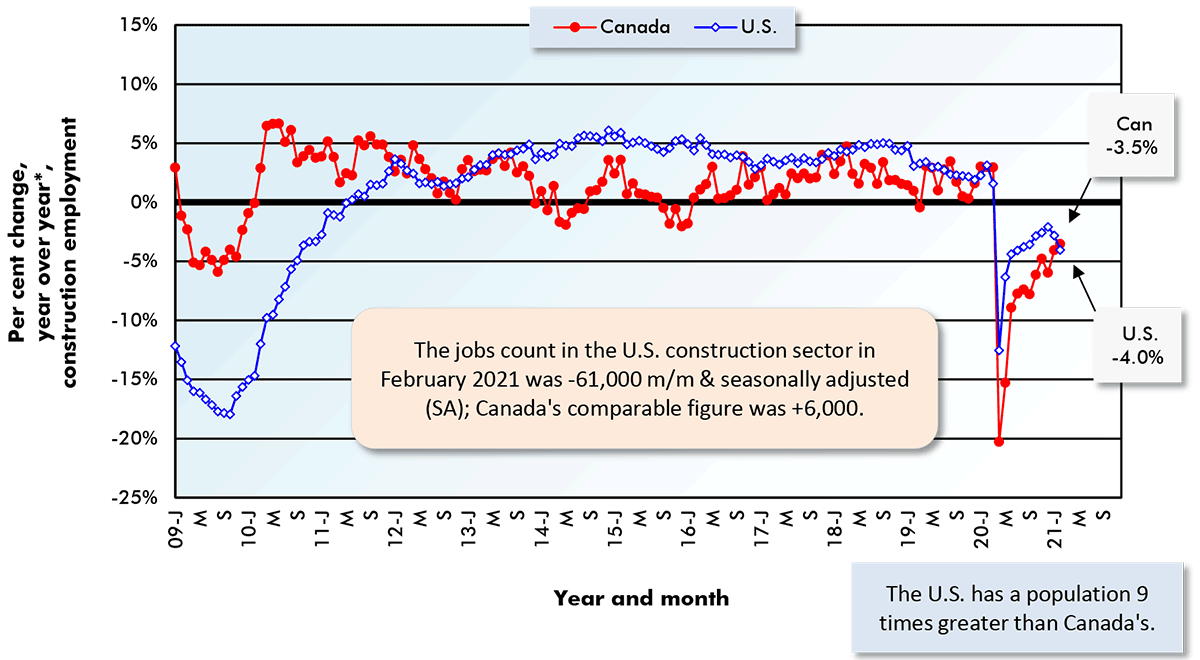
The latest data points are for February 2021.
*“Year-over-year� is each month versus the same month of the previous year.
Data sources (seasonally adjusted): Statistics Â鶹´«Ã½Ó³» and U.S. Bureau of Labor Statistics (Department of Labor).
Chart: ConstructConnect — Â鶹´«Ã½Ó³».
Change in Private Sector vs Public Sector Employment in Â鶹´«Ã½Ó³»
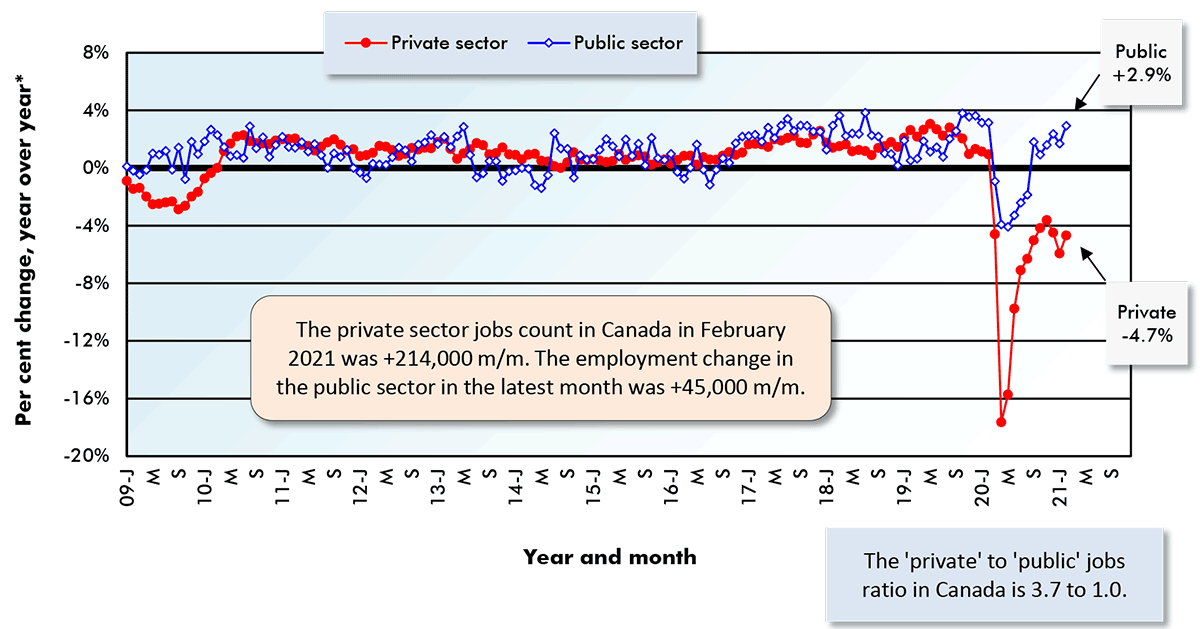
The latest data points are for February, 2021.
*“Year-over-year� is each month versus the same month of the previous year.
Data sources (seasonally adjusted): Statistics Â鶹´«Ã½Ó³».
Chart: ConstructConnect — Â鶹´«Ã½Ó³».
Change in Full-time vs Part-Time Employment in Â鶹´«Ã½Ó³»
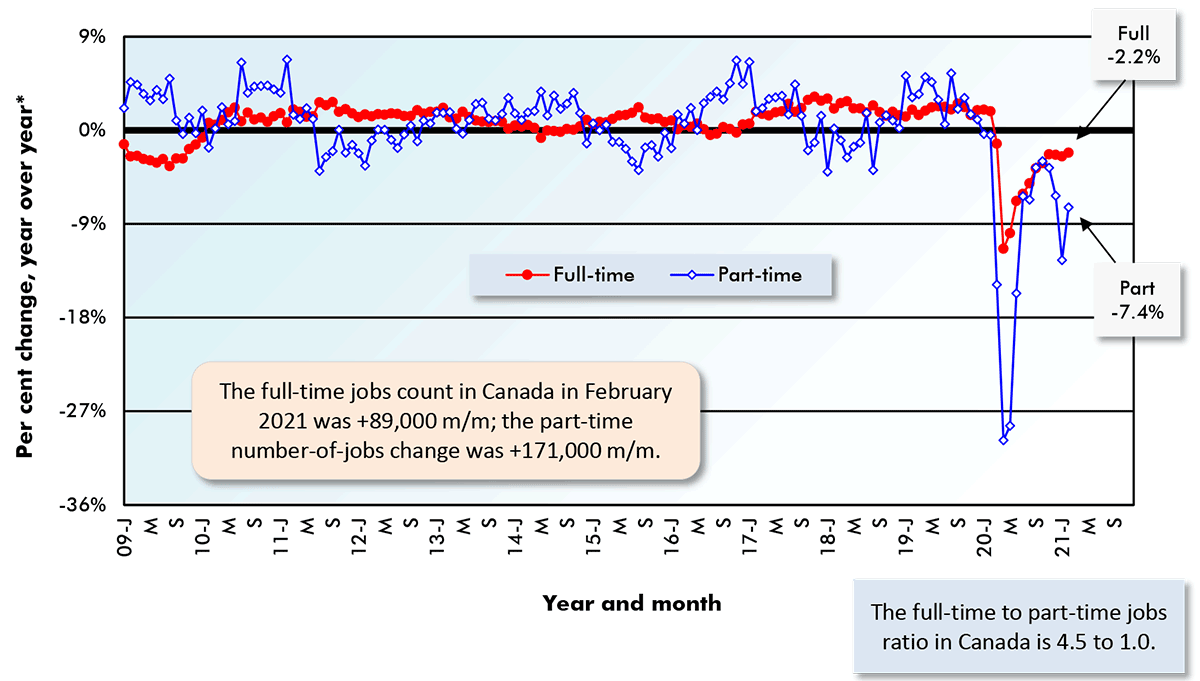
The latest data points are for February, 2021.
*“Year-over-year� is each month versus the same month of the previous year.
Data sources (seasonally adjusted): Statistics Â鶹´«Ã½Ó³».
Chart: ConstructConnect — Â鶹´«Ã½Ó³».
Change in Manufacturing Employment — Â鶹´«Ã½Ó³» vs U.S.
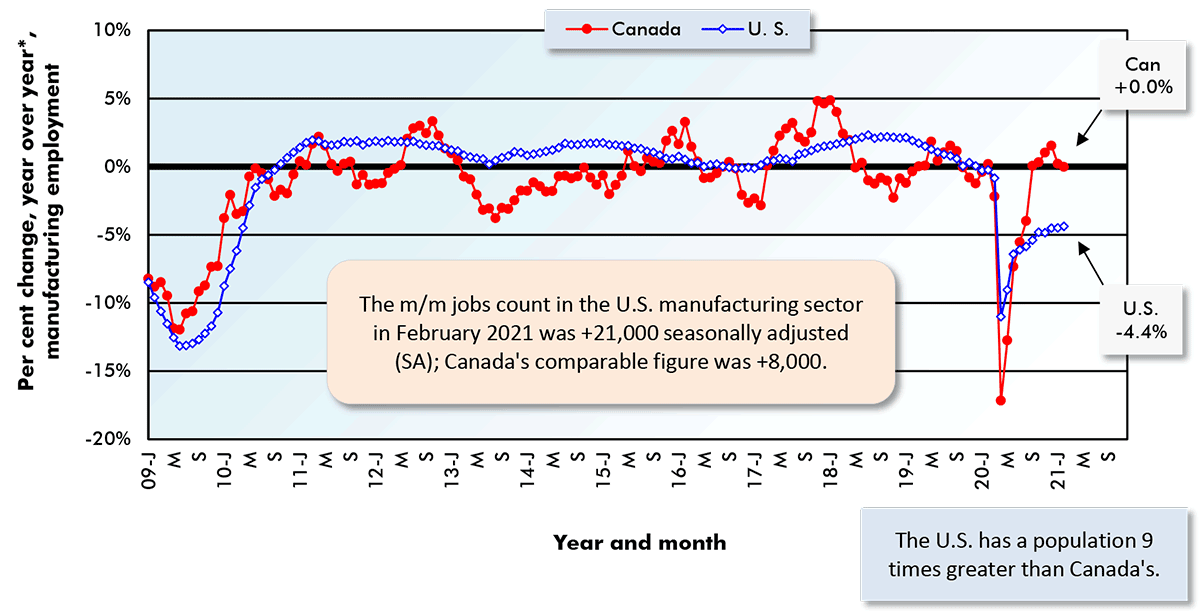
The last data points are for February, 2021.
“Year-over-year� is the monthly figure versus the same month of the previous year.
Data sources (seasonally adjusted): Statistics Â鶹´«Ã½Ó³» and U.S. Bureau of Labor Statistics.
Chart: ConstructConnect — Â鶹´«Ã½Ó³».
Change in Service Sector Employment — Â鶹´«Ã½Ó³» vs U.S.
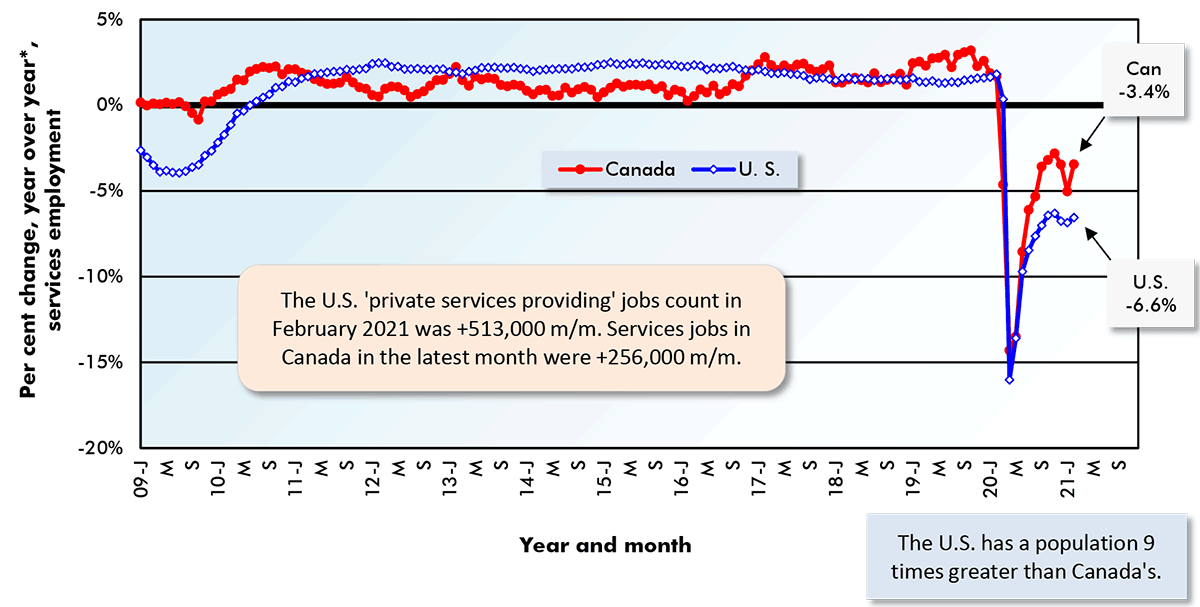
The latest data points are for February, 2021.
*“Year-over-year� is each month versus the same month of the previous year.
Data sources (seasonally adjusted): Statistics Â鶹´«Ã½Ó³» and U.S. Bureau of Labor Statistics (Department of Labor).
Chart: ConstructConnect — Â鶹´«Ã½Ó³».
Recent Comments